- Lay both laps on one distance axis — the same metre of track, not the same moment — and subtract. The delta line is your elapsed time minus the target's, metre by metre.
- Read its slope, not its height: where the line climbs you are losing time right there; flat, you are matching; falling, you are gaining.
- At a climb, read straight down the page: speed, throttle, brake and gear at that metre say why.
- Compare like with like — game, track, car, weather, session type and assists — or the gap measures the conditions, not you.
What a lap comparison is
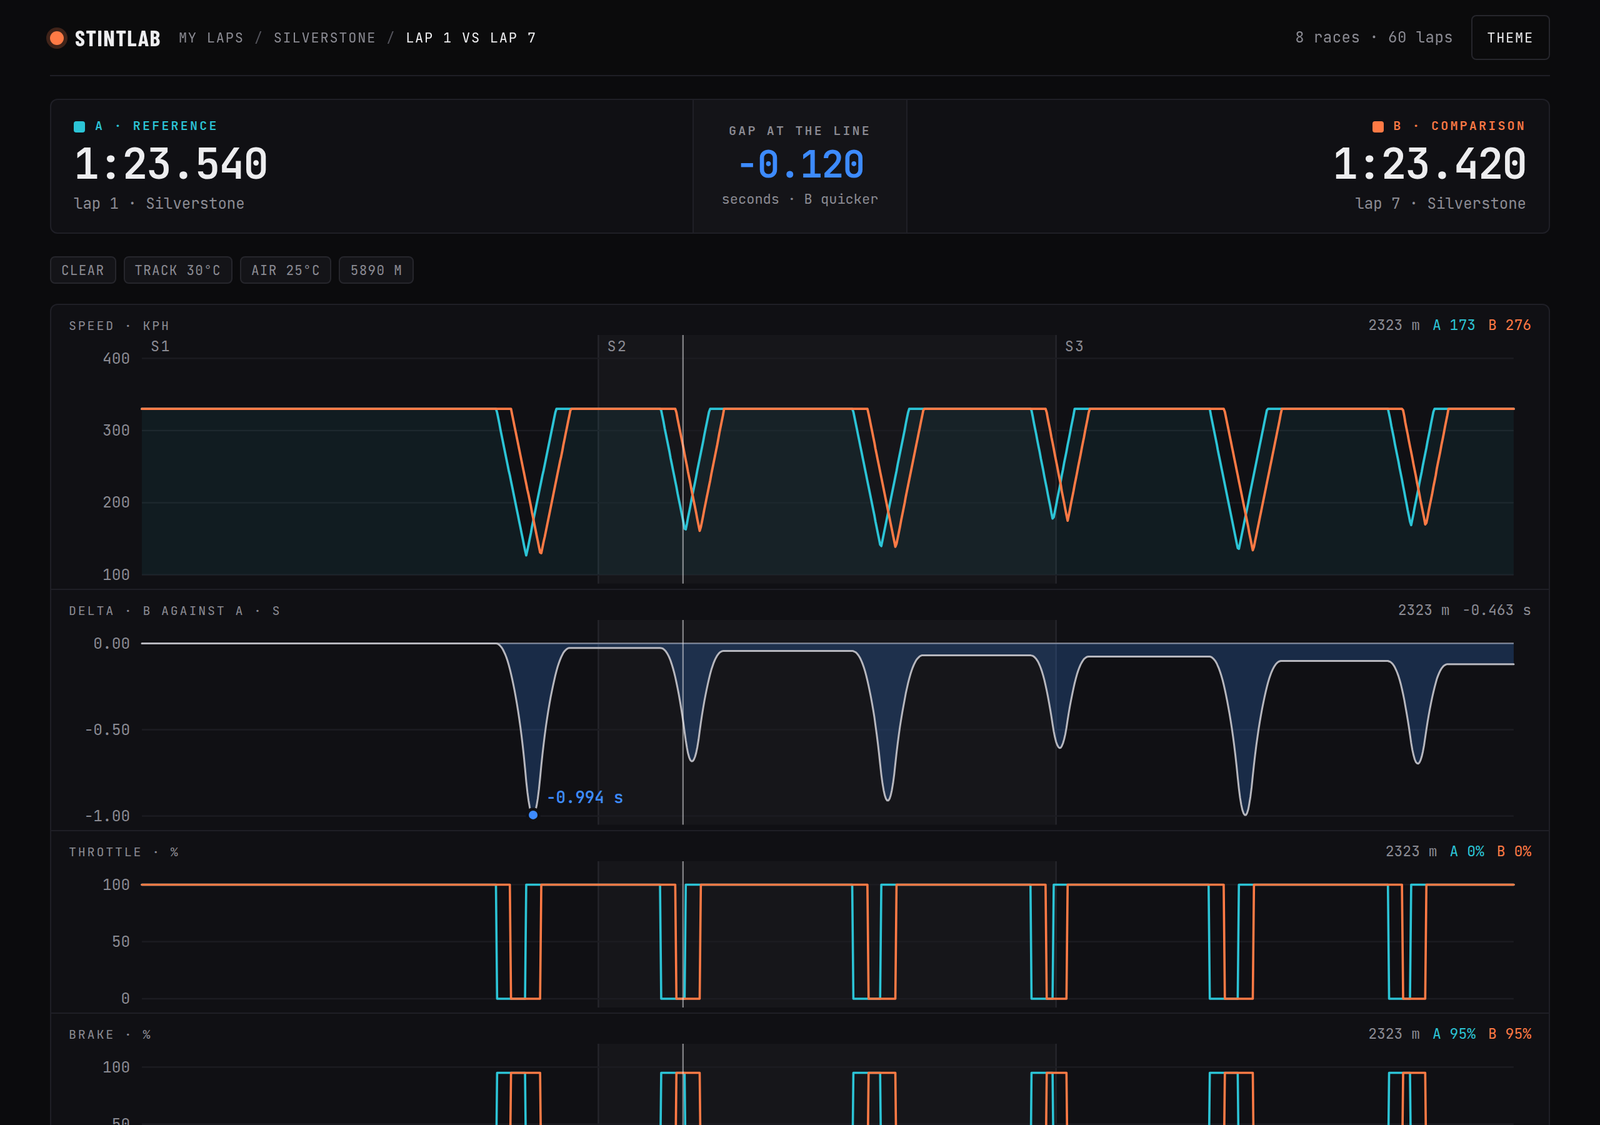
A lap comparison stacks two laps of the same circuit on top of each other: their speed, the gap between them, throttle, brake and gear, each as a trace running from the start line to the finish. One lap is the reference — your best, a target, a faster driver's lap — and the other is the lap you want to understand.
The point is not the traces themselves. Anyone can look at a speed graph and see that two lines differ. The point is to answer three questions in order: where did the time go, how much went there, and what did you do differently at that spot. The delta line answers the first two; the input traces answer the third.
Every chart and number in this guide comes from the same two synthetic laps of a circuit the length of Monza — the laps that drive the 3D circuit on StintLab's home page — run through StintLab's own comparison code. They are test laps, not a driver's record, which is exactly why they are useful here: the answer is known, so you can check the method against it.
Distance, not time: why the axis matters
The first decision in any comparison is what goes along the bottom. Plot two laps against time and they drift apart from the first corner: after 20 seconds the quicker car is further round the circuit, so the two traces at “20 s” describe different corners. Everything after the first difference is misaligned, and the misalignment grows all lap.
Plot them against distance and every vertical line on the chart is one physical point on the track. Braking zones line up with braking zones, apexes with apexes, and the gap at any point is a subtraction: your elapsed time at 1,640 m minus the target's elapsed time at 1,640 m.
StintLab records every lap on a distance grid from the start — a sample each time the car has covered at least 5 m, so up to about 1,160 samples for a lap of Monza — rather than a sample every few milliseconds. Two laps of the same circuit therefore land on one distance axis, and the gap at any metre is each lap's elapsed time there, read between the nearest samples a few metres apart. (The example laps on this page are sampled every 20 m to keep the page light.)
Reading the delta line: slope, not height
The delta line starts at zero on the start line. At each metre it shows how far behind the target your lap is so far: +0.500 means that, by this point of the lap, you have taken half a second longer to get here.
- The height of the line is the running total — the gap if the lap ended here.
- The slope is where the time is actually going. A line that climbs 0.3 s over 300 m lost those three tenths in those 300 m, whatever happened before.
- A flat line means you matched the target through that stretch, even if you are a second behind overall.
- A falling line means you were quicker there. Nobody is slower everywhere; the falling parts are worth knowing too.
That shape is typical of real laps: the gap is not spread evenly, it is made in a few places. Here, 1.193 s of the 1.317 s — 91% — is lost in three stretches totalling 1,000 m, about a sixth of the lap. Across the other five sixths, no 100 m block loses more than 0.020 s — though together they still add up to 0.124 s. A driver who spent the evening “pushing harder everywhere” would be working on the wrong 83% of the circuit.
StintLab turns the same measurement into a strip of 100 m blocks, each coloured by what it cost. It is the delta line's slope, made discrete:
Then read down: speed, throttle, brake, gear
The delta says where. To find out why, put a finger on the steepest part of the climb and read straight down the page. Here is the first and most expensive stretch, zoomed in:
Reading it from top to bottom:
- Brake. Both laps hit the pedal at 500 m with the same pressure. The braking itself is not the problem.
- Speed. The traces pull apart as the braking zone goes on. At the slowest point your lap is at 78 km/h against the target's 88 km/h — you slowed the car 10 km/h more than the corner needed.
- Throttle. The target picks up the throttle harder out of the corner; yours comes in softer and stays about ten percentage points lower until the straight.
- Delta. Only 42 ms goes in the first 100 m of braking; 366 ms goes in the 100 m through the slowest point, and another 213 ms on the way out — because a car leaving the corner 10 km/h down stays slower until both reach top speed, here by 960 m.
That last point is the most useful thing a comparison teaches: time you lose on a straight is usually decided in the corner before it. The delta climbs on the straight, but the cause is the minimum speed and the throttle a hundred metres earlier. Without the traces you would practise the wrong thing.
The braking table: the same story, corner by corner
Under the traces sits a table with one row per braking zone of the reference lap, and — when two laps are compared — how the other lap differed in each. It is the fastest way to see a pattern across a whole lap.
| Corner at | Entry | Minimum | Peak brake | Zone | Time | Brake point Δ | Minimum Δ |
|---|---|---|---|---|---|---|---|
| 500 m | 305 kph | 88 kph · G2 | 87% | 160 m | 3.71 s | same point | −10 kph |
| 1,640 m | 320 kph | 115 kph · G3 | 84% | 160 m | 2.93 s | same point | −1 kph |
| 2,440 m | 320 kph | 140 kph · G3 | 84% | 160 m | 2.68 s | same point | −10 kph |
| 3,300 m | 308 kph | 127 kph · G3 | 87% | 160 m | 3.04 s | same point | −1 kph |
| 4,240 m | 320 kph | 150 kph · G4 | 84% | 160 m | 2.60 s | same point | −10 kph |
Read as a whole, the table tells a clear story about this driver: the brake points are identical everywhere, but the minimum speed is 10 km/h down at three corners and within a kilometre an hour at the other two. This is not someone who brakes too early. It is someone who brakes in the right place and then over-slows the car at three of the five corners — a different problem, with a different drill.
The table states differences; it does not judge them. A later brake point is not automatically a better one — braking later and missing the apex costs more than it saves — which is why StintLab prints the change without calling it good or bad. The braking points guide goes through every column and what to do with each.
What the gap at the line does and does not tell you
The headline gap in a comparison is the official difference between the two lap times, exactly as the game timed them — 1:21.560 against 1:20.243 is +1.317 s. It is shown only when both laps count: valid, timed and driven from the line.
- An invalidated lap can still be overlaid — you may want to see what the quick lap you binned for track limits did differently — but it never sets a best and never gets a headline gap.
- An out-lap starts at the pit exit, so its distance is negative until the line. It does not cover the same stretch of track as a flying lap, so there is no delta to draw; the traces are shown side by side instead, with a note saying why.
- A lap with no trace — the game's telemetry did not arrive during it — is listed with its time but cannot be drawn. It is never quietly dropped.
Compare like with like
A comparison measures every difference between two laps, not just the driver. Change any of these and the gap is partly — sometimes mostly — measuring something else:
- Car and track layout. Obvious, until it isn't: a short layout of the same venue is a different track.
- Weather and session type. A wet practice lap and a dry qualifying lap are different events.
- Assists. A lap with the racing line or braking assist on is not a target for one without.
- Game version and telemetry format. Handling changes between patches.
- Fuel and tyres. A low-fuel lap on new softs against a heavy-fuel lap on worn mediums is a strategy difference, not a driving one.
StintLab enforces the first four whenever it picks a target for you: laps are only matched when the game, track, car, weather, session type, telemetry format, game version, formula and assists — steering, braking, gearbox, ERS, DRS and the racing line — all agree, and the track length agrees within 20 m. Fuel, tyres and setup cannot be matched from telemetry alone, so every practice plan carries the same line: “Fuel, tyres and setup may differ. These are observed gaps, not promised gains.”
How to compare two laps in StintLab
- Open the session.View → My laps lists your sessions, one row per race or run: when, where, the game, car and conditions, laps driven, best lap and theoretical best. Click the one you want.
- Tick two laps.Every lap is listed in the order you drove it, with its sectors — your best of each sector marked ◆ — its gap to your best, and whether it counts. Tick two to overlay them; tick one to read it alone with its braking zones.
- Read the delta, then read down.Find where the delta climbs. Hover there and read speed, throttle, brake and gear for both laps at that metre. Play the lap back if you want to see it happen.
- Check the braking table.Look for a pattern across corners — the same brake points but lower minimum speeds, or brake points that drift — rather than one number.
- Chase something faster.To compare against the fastest matching lap in your whole history, or a friend's imported lap, use the Your next goal panel: it adds a practice plan on top of the overlay.
Questions
Why does the delta keep rising on a straight?
Often because you left the corner before it slower. A car that exits 10 km/h down stays slower until both cars reach top speed, so the delta keeps climbing well after the mistake. DRS, a tow or energy deployment can open a gap on a straight too. Look back to the last corner's minimum speed and throttle pick-up before blaming the straight itself.
Can I compare two laps from different sessions?
Tick-to-compare works on any two laps of one session. Across sessions, the Your next goal panel finds the fastest matching lap in your whole history and compares against that, and a lap file from any session can be imported as a reference.
Can I compare my lap with a friend's?
Yes. Every StintLab lap is a plain file, lap_<n>.json. Your friend sends theirs, you choose Laps → Import reference lap…, and it becomes a target once it passes the same checks as your own laps: a valid, fully traced lap of the same game, track, car, weather, session type and assists.
Why is there no delta line for my out-lap?
An out-lap starts at the pit exit, so its distance runs negative until it crosses the line. It does not cover the same stretch of track as a flying lap, and a delta between the two would be measuring the pit lane. StintLab still draws both laps' traces side by side and says why there is no delta.
Can I compare an F1 25 lap with an Assetto Corsa lap at the same circuit?
No. Two games are two tracks: different surveys, different cars, different physics. StintLab keeps them apart everywhere, because merging them would invent gains of many seconds that no driver found.
Does lap comparison work if I drive with a controller?
Yes. StintLab reads what the game broadcasts — speed, pedal positions, gear — and does not know or care what you steer with. Pad inputs just look different in the traces.